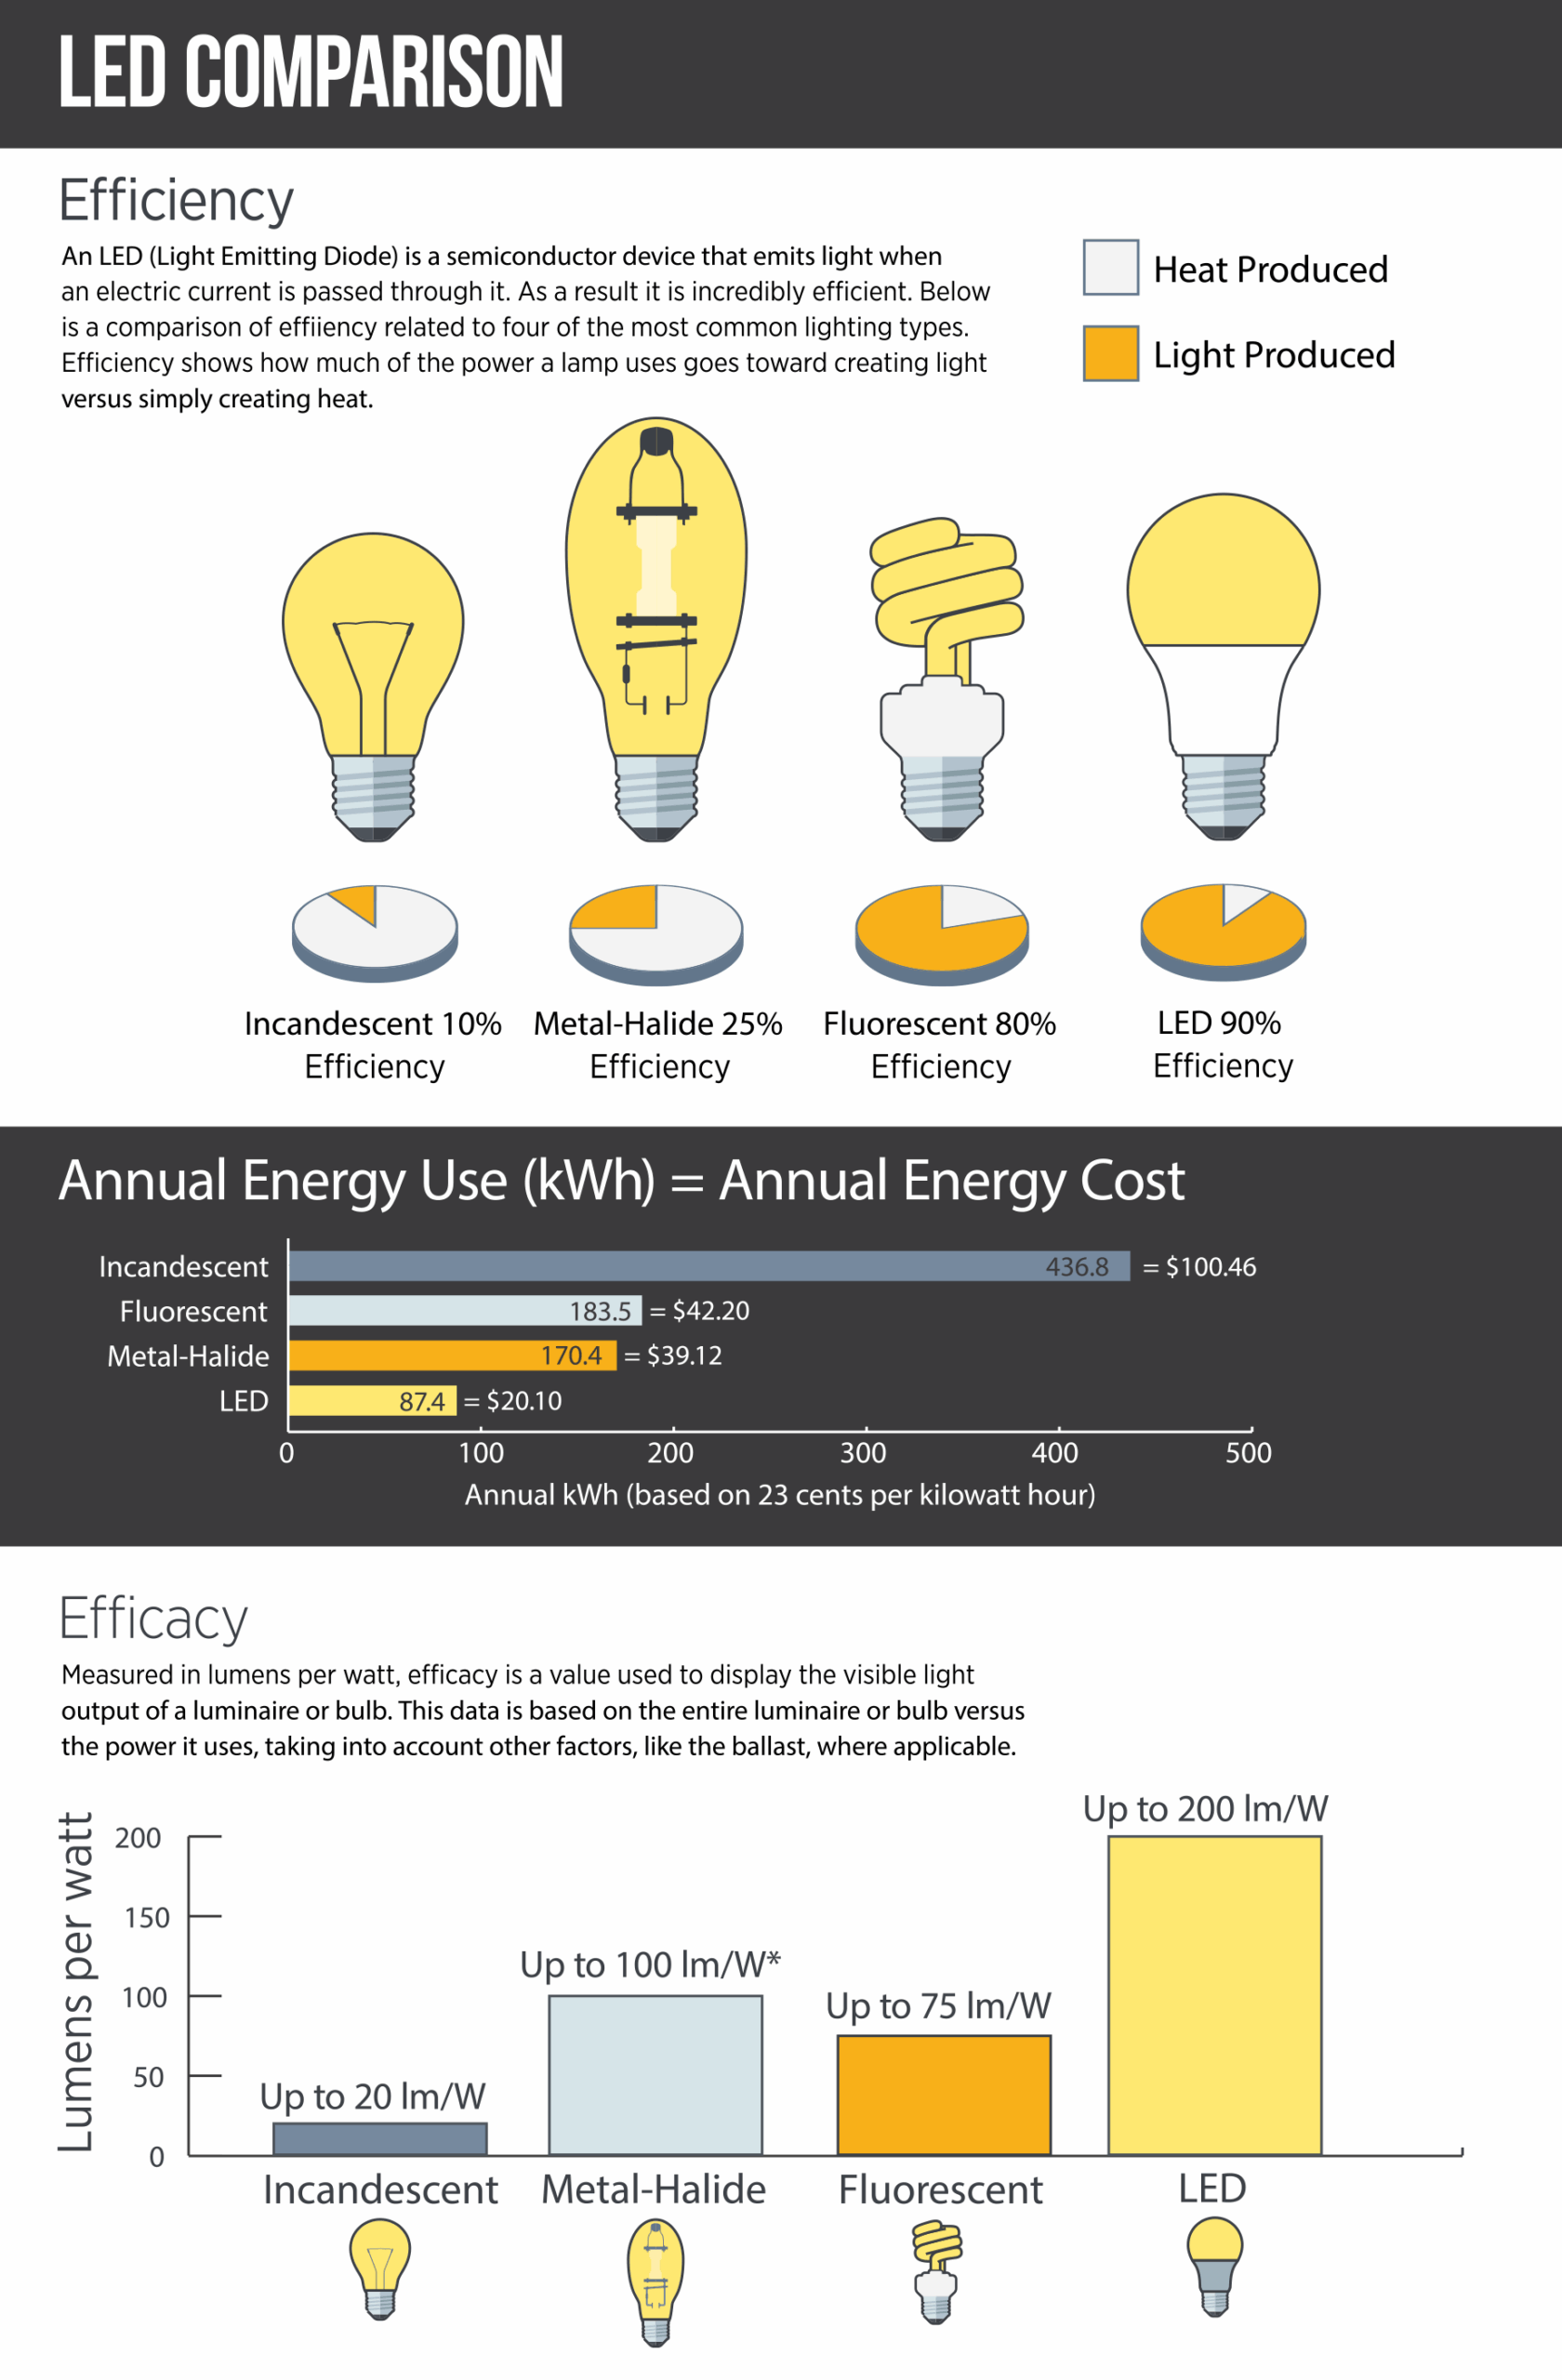
LED Comparison Infographic
Project Overview
This infographic was created to clearly illustrate the efficiency, energy use, and efficacy of various lighting technologies, specifically incandescent, metal-halide, fluorescent, and LED. The goal was to present technical information in a way that is both visually engaging and easy for consumers to understand.
Process
I led the entire design process, beginning with in-depth research into lighting performance metrics. I gathered and verified data points such as energy consumption, annual operating costs, and lumens per watt, ensuring technical accuracy. I also authored all the written content, breaking down complex electrical concepts into accessible language.
Deliverables
- Technical research and data analysis
- Consumer-friendly content writing
- Vector illustrations and data visualization design
- Interactive tooltip lightbox for e-commerce website
Demonstrates expertise in technical communication design and data visualization.

